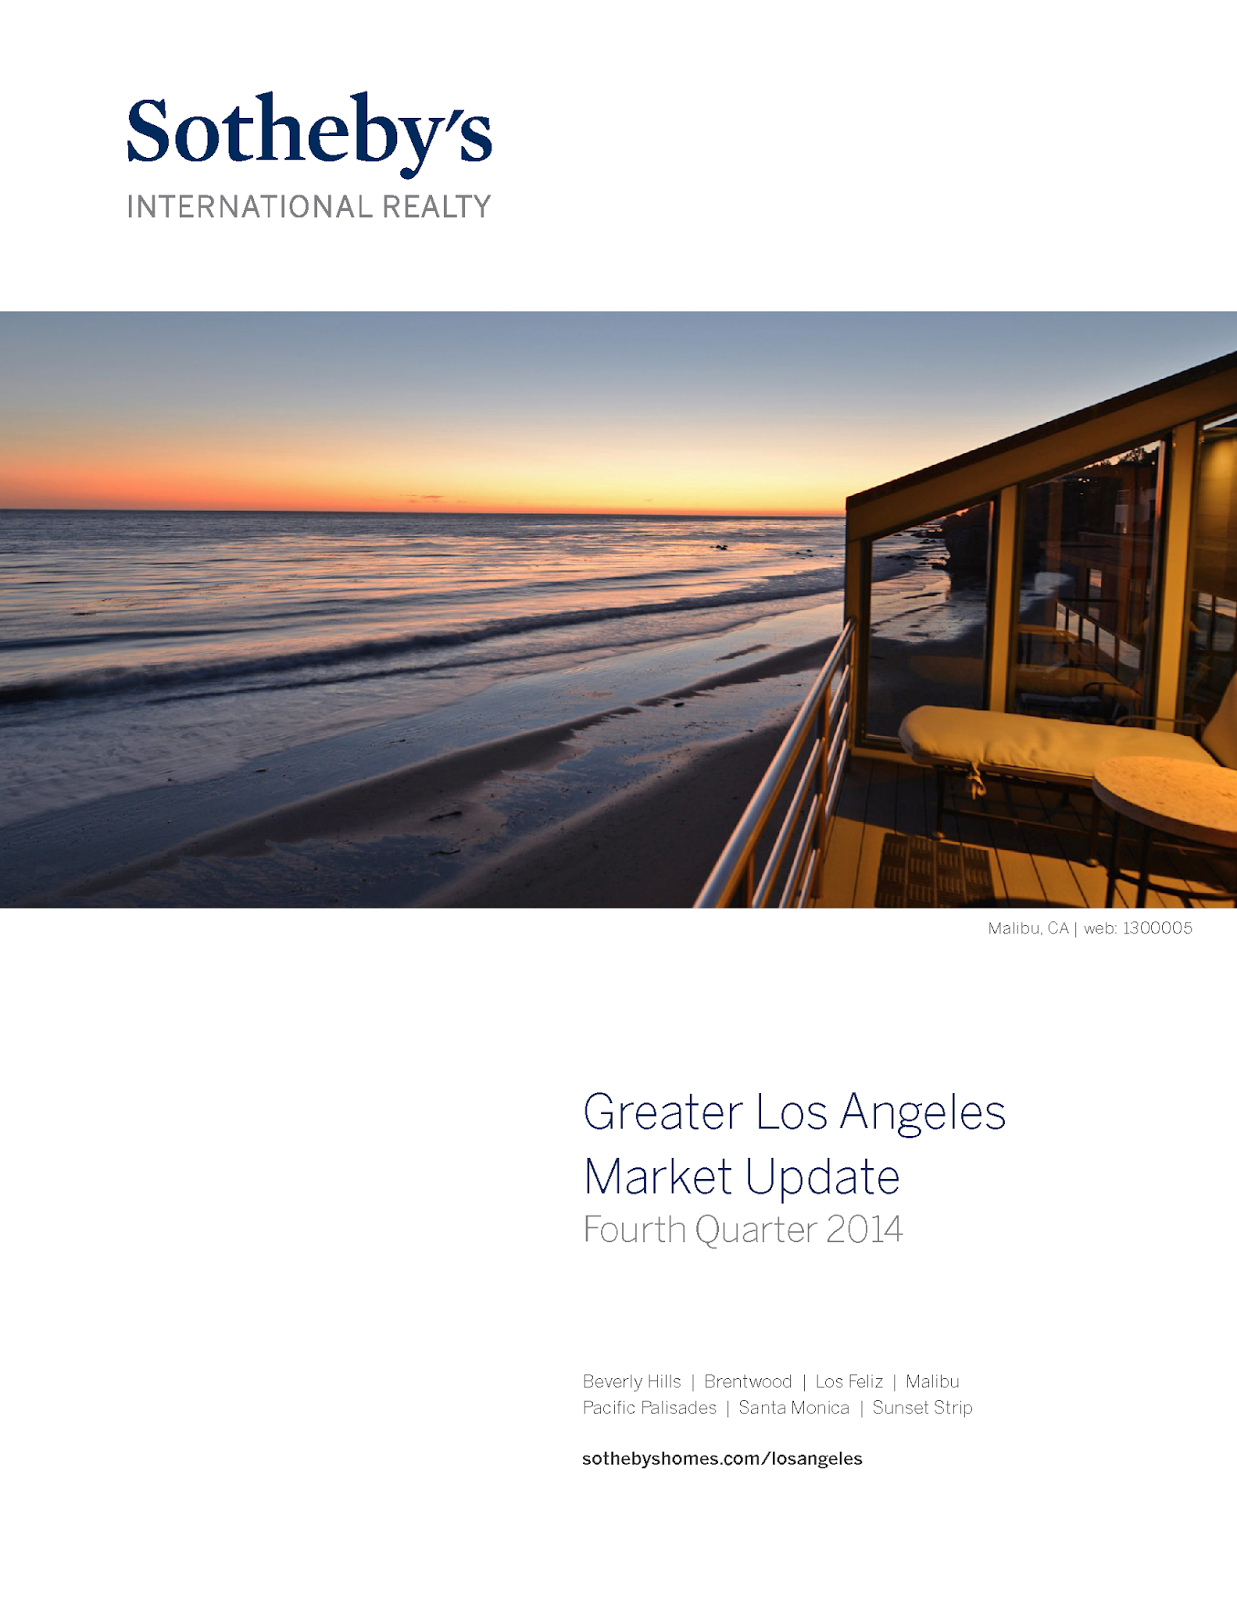
Happy New Year to everyone. As we kick off 2015, it is always informative to take a quick look back at the 4th Quarter of last year and see how the local real estate business did in comparison to 2013. Sotheby’s International Realty recently released their Greater Los Angeles Market Update – Fourth Quarter 2014.
The report covers a wide number of local communities in the Los Angeles area as revealed by looking over the table of contents. I am trying to track down similar reports for some areas in the Valley and Glendale/Pasadena areas and if I am successful in locating them, I will update this report.
Generally, prices are up in most areas and in some areas they are up considerably. When prices are down they tend to be in the relatively low perentage levels. The report breaks out both Single Family Homes and Condominium Sales for each area.
As for the areas along the coast on the west side of Los Angeles, the table below shows the 4th Quarter Average Sale Price along with the percentage change from the 4th Quarter of 2013.
Allow me to give you an overview of how the reports work for each individual market area in the report. Each area features two pages: one for Single Family Residences and one for Condos. Let’s take a look at the page for Single Family Residences for Pacific Palisades.
There are three sections on each page. The top section is for Oct-Dec 2014, the middle section is for Oct-Dec 2013 and the bottom section shows the percentage change between 2013 and 2014. Each section has four columns that break out the sale by dollar amount of the sale. The first column presents total sales, the second column shows properties of less than $1 million (none of those in Pacific Palisades), the third column is for sales in the $1 – $3 million range and the fourth column is for properties over $3 million.
Last but not least, let’s take a look at the detailed line items in each group. They are:
- Average List Price
- Average List Price per Square Foot
- Average Sold Price
- Average Sold Price per Square Foot
- Total SFH Properties Sold
- Total SFH Properties for Sale at the End of the Period
- Average Monthly Supply of Inventory
- Average Sold Price / Average List Price (Ratio)
So now that you have the big picture on this informative report, if you are ready to climb into the data, you can download it here: Los Angeles Area Real Estate Sales – 4th Quarter Report
TinyURL for this post is: http://tinyurl.com/jimrea-4q-2014
My pledge to you is to professionally handle all of your real estate needs whether it is searching for a new home or property, selling one that you already have or helping you address your real estate needs anywhere in the world. My goal is to make your real estate experience pleasant, productive, focused and hassle free.
I would love to discuss any real estate needs that you may have. Please give me a call at any time.
Jim Rea, Realtor
Sotheby’s International Realty – Pacific Palisades
(424) 354-0790
Jim@JimRea.com


